Today there is no shortage of stock analysis sites. You can get virtually any information from there. But generally we don’t do heady duty analysis or track tons of information on daily basis. For example, we track handful of stocks whether any of them does down by more than 20 percent from its 52-week peak. For this, you don’t have to go to a number of web sites and filter out the information you are looking for. You can do you customized stock analysis on Google Sheet easily. If can configure your Google sheet the exact information you are interested in.
Google Sheet is part of free, web-based office suite offered by Google. It is like MS Excel. It is very popular to maintain personal spreadsheets.
We’ll use GOOGLEFINANCE function to access stock data from Google Finance.
Display the Current Stock Price
We’ll start with a simple example of displaying current price of a stock. For that you need to know the stock symbol and the symbol of the exchange the stock is trading in.
You can simple search for the symbol of a company on Google. Like I searched for ‘apple stock symbol‘ to get the symbol of Apple Inc.
So I got the symbol “NASDAQ:AAPL“. You can use this to get the current price of Apple on your Google Sheet.
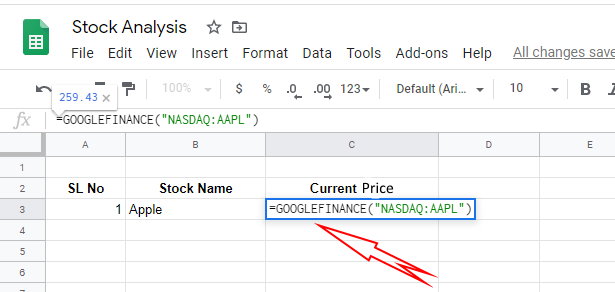
Just enter the formula ‘=GOOGLEFINANCE(“NASDAQ:AAPL”)‘ in a cell. I entered that in ‘C3‘ cell. In ‘B3’ cell, I put the name of the company for convenience.
You’ll get Apple’s current stock price like this.
You can open this spreadsheet anywhere from desktop or mobile phone, you’ll get the current price of Apple.
How much a Stock Price is Down from 52-Week High
As an investor, you can have a strategy to buy a stock if it is down by 20 percent from the 52-week peak. In this section, we’ll see how we can track how much a stock is down from its 52-week peak.
Now you should know little bit about the syntax of the GOOGLEFINANCE function.
GOOGLEFINANCE(ticker, [attribute], [start_date], [end_date|num_days], [interval])
The ticker is basically the stock symbol like “NASDAQ:AAPL“. Attribute is basically what information we want to fetch. Example attributes are ‘price‘, ‘high‘, ‘low‘, ‘volume‘ etc. Attributes like ‘start_date‘, ‘end_end‘, ‘interval‘ are used to get historical data series.
We’ll use ‘high52‘ attribute to get the 52-week high price. So our formula would be ‘=GOOGLEFINANCE(” NASDAQ:AAPL “, “high52”)‘.
We applied the formula on cell ‘D3‘. So we get the current price in ‘C3‘ and 52-week high price in ‘D3‘. Now we can apply a spreadsheet formula to calculate how much (in percent) the stock is down from its 52-week peak price. The formula is ‘=(D3-C3)*100/D3‘.
Now we can see how much the stock is down from the peak.
Conditionally Highlight Cell
If you track multiple stocks, then it will be easier to highlight the cell if the value is more than 20. It would easier to figure out only those stocks that are more than 20 percent down.
Select the cell and click ‘Format->Conditional formatting‘.
The ‘Conditional format rules‘ window will appear in the right side of the spreadsheet. Select ‘Greater than‘ from the ‘Format cells if‘ drop-down list. One edit box will appear. Put 20 in that box and select fill color to ‘red’.
Now if the ‘E3‘ cell value is greater than 20, the cell will be highlighted as red.
Here we can see that Apple is down more than 20 percent and ‘E3‘ cell is highlighted. But for Microsoft is within 20 percent. That’s why ‘E4’ is not highlighted.
Analytical Data
If you are a trader, you might be interested in the information like, day’s high, low, volume, change from previous day’s close etc.
Here are the formulas to get those information for Apple.
Day’s High Price: =GOOGLEFINANCE(“NASDAQ:AAPL”, “high”)
Day’s Low Price: =GOOGLEFINANCE(“NASDAQ:AAPL”, “low”)
Change from Previous Day’s Close: =GOOGLEFINANCE(“NASDAQ:AAPL”, “priceyest”)
Day’s Volume: =GOOGLEFINANCE(“NASDAQ:AAPL”, “volume”)
But if you are an investor, you could be more interested in the information like market capitalization, price earning (P/E) ratio, earning per share (EPS).
Formulas for these information for Google:
Market Capitalization: =GOOGLEFINANCE(“NASDAQ:AAPL”, “marketcap”)
Price Earning Ratio: =GOOGLEFINANCE(“NASDAQ:AAPL”, “pe”)
Earning Per Share: =GOOGLEFINANCE(“NASDAQ:AAPL”, “eps”)
Stock Trend
So far, we fetched numerical values. We can also fetch a data series and display a graph using that series. For example, we can fetch daily closing prices of a stock for last one year and display that in a line graph.
Formula for that: =SPARKLINE(GOOGLEFINANCE(“NASDAQ:AAPL”, “price”, TODAY()-365, TODAY()))
This is fairly complex formula.
‘GOOGLEFINANCE(“NASDAQ:AAPL”, “price”, TODAY()-365, TODAY()) ‘ returns a series of daily closing prices for last one year.
If we pass this data to SPARKLINE function, we’ll get a graph like this.
This type of graphs will give you a sense of the price movement and direction throughout the year.
Conclusion
These examples give you an idea how you can use Google Sheet to design your own analytical tool that can be accessed from anywhere. You can mix stock from multiple exchanges also.
sir,
how to write formula of today volume grater then AVERAGE of last 10 day
and price cross WEEKLY 10 sma and 20 sma
i hope you can help me